2 The Level or Center of a Batch (Ch. 2)
Build a data frame containing the flake data that Drennan uses (yes, I could give you the data, but it’s useful to understand where data frames come from). Note that for our ‘Context’ column R will recycle the value we specify to populate all the rows; this means that you can specify the number of values that matches other columns or a single value. We’ll build separate data frames for each pit, and then stick them together (rbind() binds data frames by stacking them, adding rows and maintaining the same number of columns; cbind() by extending them, adding columns and maintaining the same number of rows).
Pit1 <- data.frame(Context="Pit 1", Weight = c(9.2, 12.9, 11.4, 9.1, 28.6, 10.5,
                                             11.7, 10.1, 7.6, 11.8, 14.2, 10.8))
Pit2 <- data.frame(Context="Pit 2", Weight = c(11.3, 9.8, 14.1, 13.5, 9.7, 12, 7.8,
                                             10.6, 11.5, 14.3, 13.6, 9.3, 10.9))

# then stick them together
Flakes <- data.frame(rbind(Pit1, Pit2))
Flakes
## Context Weight
## 1 Pit 1 9.2
## 2 Pit 1 12.9
## 3 Pit 1 11.4
## 4 Pit 1 9.1
## 5 Pit 1 28.6
## 6 Pit 1 10.5
## 7 Pit 1 11.7
## 8 Pit 1 10.1
## 9 Pit 1 7.6
## 10 Pit 1 11.8
## 11 Pit 1 14.2
## 12 Pit 1 10.8
## 13 Pit 2 11.3
## 14 Pit 2 9.8
## 15 Pit 2 14.1
## 16 Pit 2 13.5
## 17 Pit 2 9.7
## 18 Pit 2 12.0
## 19 Pit 2 7.8
## 20 Pit 2 10.6
## 21 Pit 2 11.5
## 22 Pit 2 14.3
## 23 Pit 2 13.6
## 24 Pit 2 9.3
## 25 Pit 2 10.9Calculate summary statistics.
## [1] 12.325## [1] 11.1## [1] 11.41538## [1] 11.3## Flakes$Context: Pit 1
## [1] 12.325
## ------------------------------------------------------------
## Flakes$Context: Pit 2
## [1] 11.41538## Flakes$Context: Pit 1
## [1] 11.1
## ------------------------------------------------------------
## Flakes$Context: Pit 2
## [1] 11.3## [1] 11.17## [1] 11.48182## Flakes$Context: Pit 1
## [1] 11.17
## ------------------------------------------------------------
## Flakes$Context: Pit 2
## [1] 11.48182To examine batches with multiple peaks, we’ll create another data frame.
BlackSmith <- data.frame(Area = c(18.3, 18.8, 16.7, 6.1, 5.2, 21.2, 19.8, 4.2, 18.3,
                                3.6, 20.0, 7.5, 15.3, 26.8, 5.4, 18.7, 6.2, 7.0, 20.7,
                                18.9, 19.2, 6.7, 19.1, 23.4, 4.5, 16.2, 5.6, 17.5,
                                5.9, 6.7, 4.9, 17.9, 15.0, 13.6, 5.4, 5.8))
BlackSmith
## Area
## 1 18.3
## 2 18.8
## 3 16.7
## 4 6.1
## 5 5.2
## 6 21.2
## 7 19.8
## 8 4.2
## 9 18.3
## 10 3.6
## 11 20.0
## 12 7.5
## 13 15.3
## 14 26.8
## 15 5.4
## 16 18.7
## 17 6.2
## 18 7.0
## 19 20.7
## 20 18.9
## 21 19.2
## 22 6.7
## 23 19.1
## 24 23.4
## 25 4.5
## 26 16.2
## 27 5.6
## 28 17.5
## 29 5.9
## 30 6.7
## 31 4.9
## 32 17.9
## 33 15.0
## 34 13.6
## 35 5.4
## 36 5.8## 1 | 2: represents 1.2
## leaf unit: 0.1
## n: 36
## 1 3 | 6
## 4 4 | 259
## 10 5 | 244689
## 14 6 | 1277
## 16 7 | 05
## 8 |
## 9 |
## 10 |
## 11 |
## 12 |
## 17 13 | 6
## 14 |
## (2) 15 | 03
## 17 16 | 27
## 15 17 | 59
## 13 18 | 33789
## 8 19 | 128
## 5 20 | 07
## 3 21 | 2
## 22 |
## 2 23 | 4
## 24 |
## 25 |
## 1 26 | 8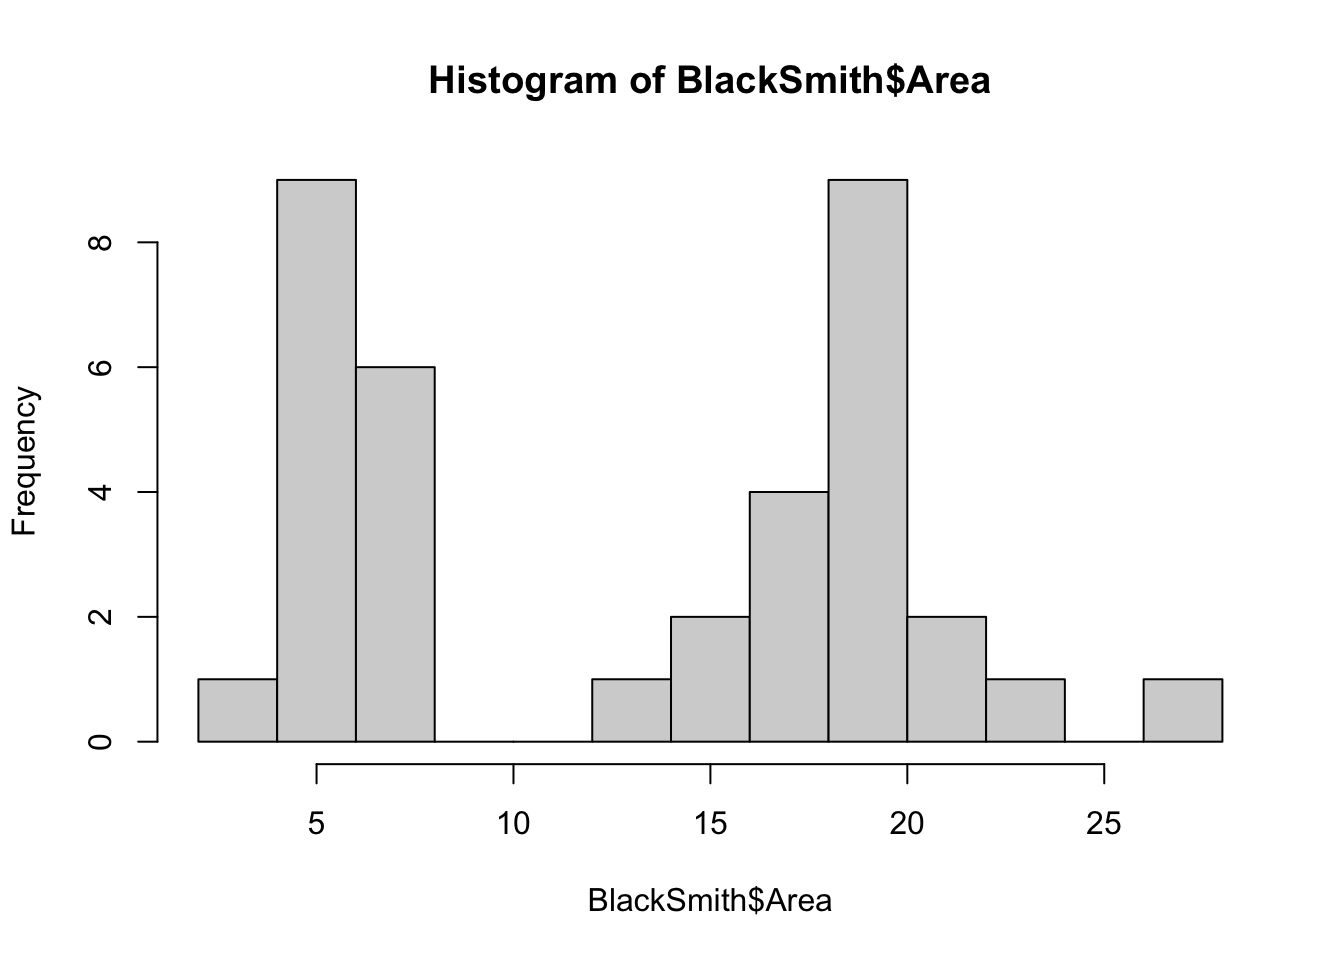
## BlackSmith$Area > 10: FALSE
## [1] 5.66875
## ------------------------------------------------------------
## BlackSmith$Area > 10: TRUE
## [1] 18.77## BlackSmith$Area > 10: FALSE
## [1] 5.7
## ------------------------------------------------------------
## BlackSmith$Area > 10: TRUE
## [1] 18.75