3 Building more complex plots
3.1 Multiple plot panes in Base R
What if we wanted to, for example, compare boxplot and violin plot side-by-side? The simplest way to juxtapose plots is to adjust the mfrow parameter of your graphics pane (if you’re working in the console rather than knitting R Markdown, this will keep the new setting until you reset it using dev.off()).
#set the mfrow parameter in par() to one rows and two columns
par(mfrow  =  c(1,2))

boxplot(Area ~ Period, nanxiong, ylab = "Area (ha)", col = c("lightgreen", "salmon"))
vioplot(Area ~ Period, nanxiong, ylab = "Area (ha)", col = c("lightgreen", "salmon"))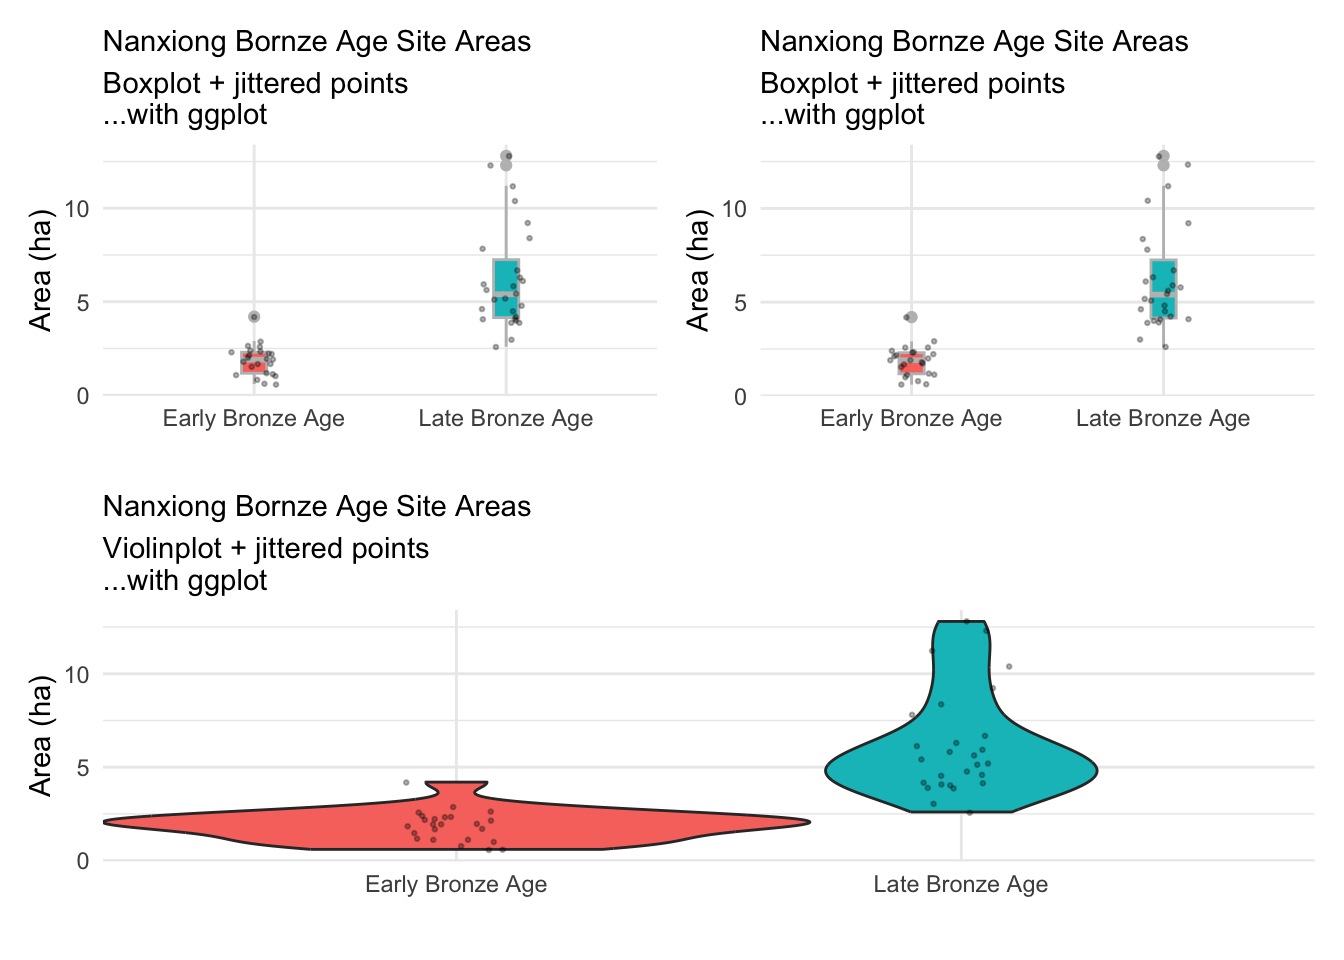
#or vertically instead

par(mfrow  =  c(2,1))

boxplot(Area ~ Period, nanxiong, ylab = "Area (ha)", col = c("lightgreen", "salmon"), title = "Boxplot")
vioplot(Area ~ Period, nanxiong, ylab = "Area (ha)", col = c("lightgreen", "salmon"))
Note that you may rapidly bump up against problems caused by the default graphics settings, which don’t always allocate space as you’d like for multiple panes. Very often you might like to limit the amount of white space between plots (allowing them to be larger); experiment with par(mar =) to do this (see ?par).
There’s no reason to limit yourself to two panes - mfrow(c(3,3)) will give you three of each, for instance. Multiple panes exploring multiple permutations of variables are common, though they do risk becoming too complex for viewers to digest.
3.2 Multiple plot panes in ggplot2
Thomas Lin Pedersen’s patchwork package enables something similar for ggplot2 graphics - and does so well enough to constitute an argument for using ggplot.
To use it, write the output of your plots to objects, then combine those.
library(patchwork)

p_viol <- ggplot(data = nanxiong, aes(x = Period, y = Area, fill = Period)) +
    geom_violin(width=1.4) +
    geom_point(size = .5, position = position_jitter(.1), alpha = .3) +
    theme_minimal() +
    theme(
      legend.position="none",
      plot.title = element_text(size=11)
    ) +
    labs(x = "", y = "Area (ha)", title = "Nanxiong Bornze Age Site Areas",
         subtitle = "Violinplot + jittered points\n...with ggplot")

p_box <- ggplot(data = nanxiong, aes(x = Period, y = Area, fill = Period)) +
    geom_boxplot(width=0.1, color="grey") +
    geom_point(size = .5, position = position_jitter(.1), alpha = .3) +
    theme_minimal() +
    theme(
      legend.position="none",
      plot.title = element_text(size=11)
    ) +
    labs(x = "", y = "Area (ha)", title = "Nanxiong Bornze Age Site Areas",
         subtitle = "Boxplot + jittered points\n...with ggplot")

p_viol + p_box

The logic of arrangement can be extended to more panes.
More complex arrangements with more elements are possible, as are various neat tricks likes shared axes; see the documentation for details.